
Learning Analytics
Visualize your vocabulary recall trends, daily task consistency, and monthly study time heatmaps.
Overview
The Analytics dashboard provides visual feedback on your learning habits, memory retention, and study consistency over time.
Instead of guessing whether your Mandarin is improving, these three visual reports track your active recall accuracy, monthly daily task streaks, and daily time investment.
1. Word Identification Line Chart
The Word Identification chart tracks your vocabulary recall accuracy across your recent study sessions, helping you measure how well words are sticking in your long-term memory:
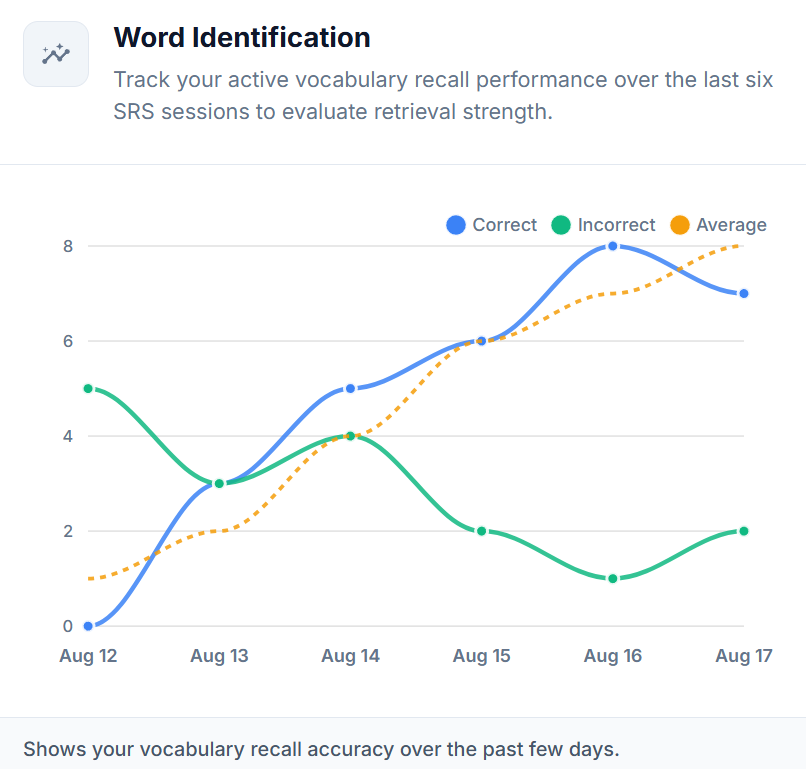
- Blue Line (
Correct): The volume of words you successfully recalled during flashcard sessions and vocabulary quizzes. - Green Line (
Incorrect): Words that required assistance or were answered incorrectly. - Gold Line (
Average): Your net daily recall trend line over the past few days.
2. Daily Task Completion Ring
The Daily Task Completion chart uses concentric progress rings to measure your study consistency throughout the current calendar month:
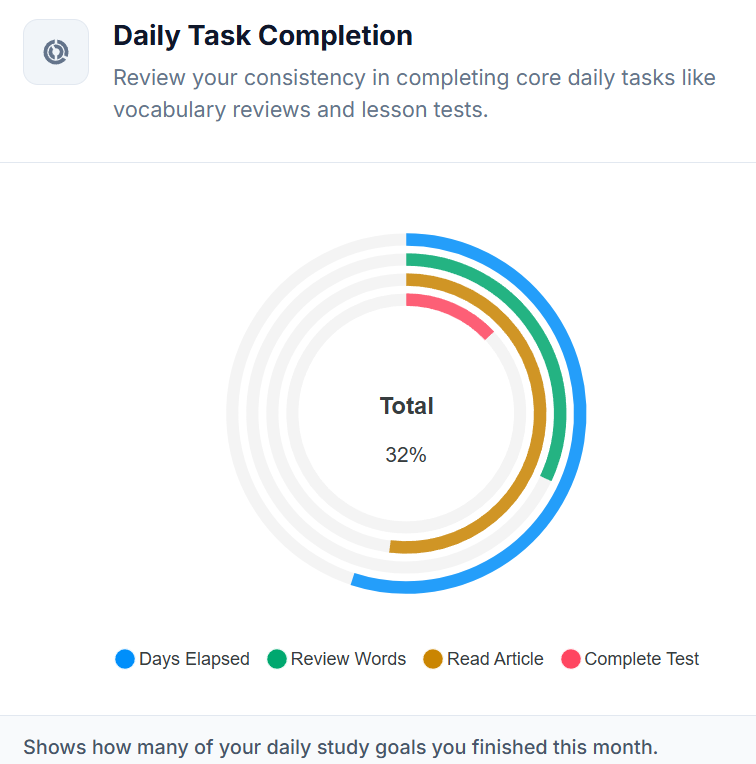
How the Rings Work:
- Benchmark Ring (
Days Elapsed- Blue): Represents the progression of days in the current month (e.g., day 15 of 30 = 50% circle). - Task Rings: Each inner ring measures how many of that specific daily task you completed this month:
- Review Words (Green): Flashcard reviews completed.
- Read Article (Gold): Reading passages finished.
- Complete Test (Red): Vocabulary quizzes or exercises passed.
Habit Goal
If your inner colored rings keep pace with the outer blue Days Elapsed ring, you have maintained a consistent daily study habit for the entire month!
3. Learning Time Calendar (Monthly Heatmap)
The Learning Time Calendar maps your focused study duration across a monthly grid, providing a visual heatmap of your study consistency against your personal learning goals.
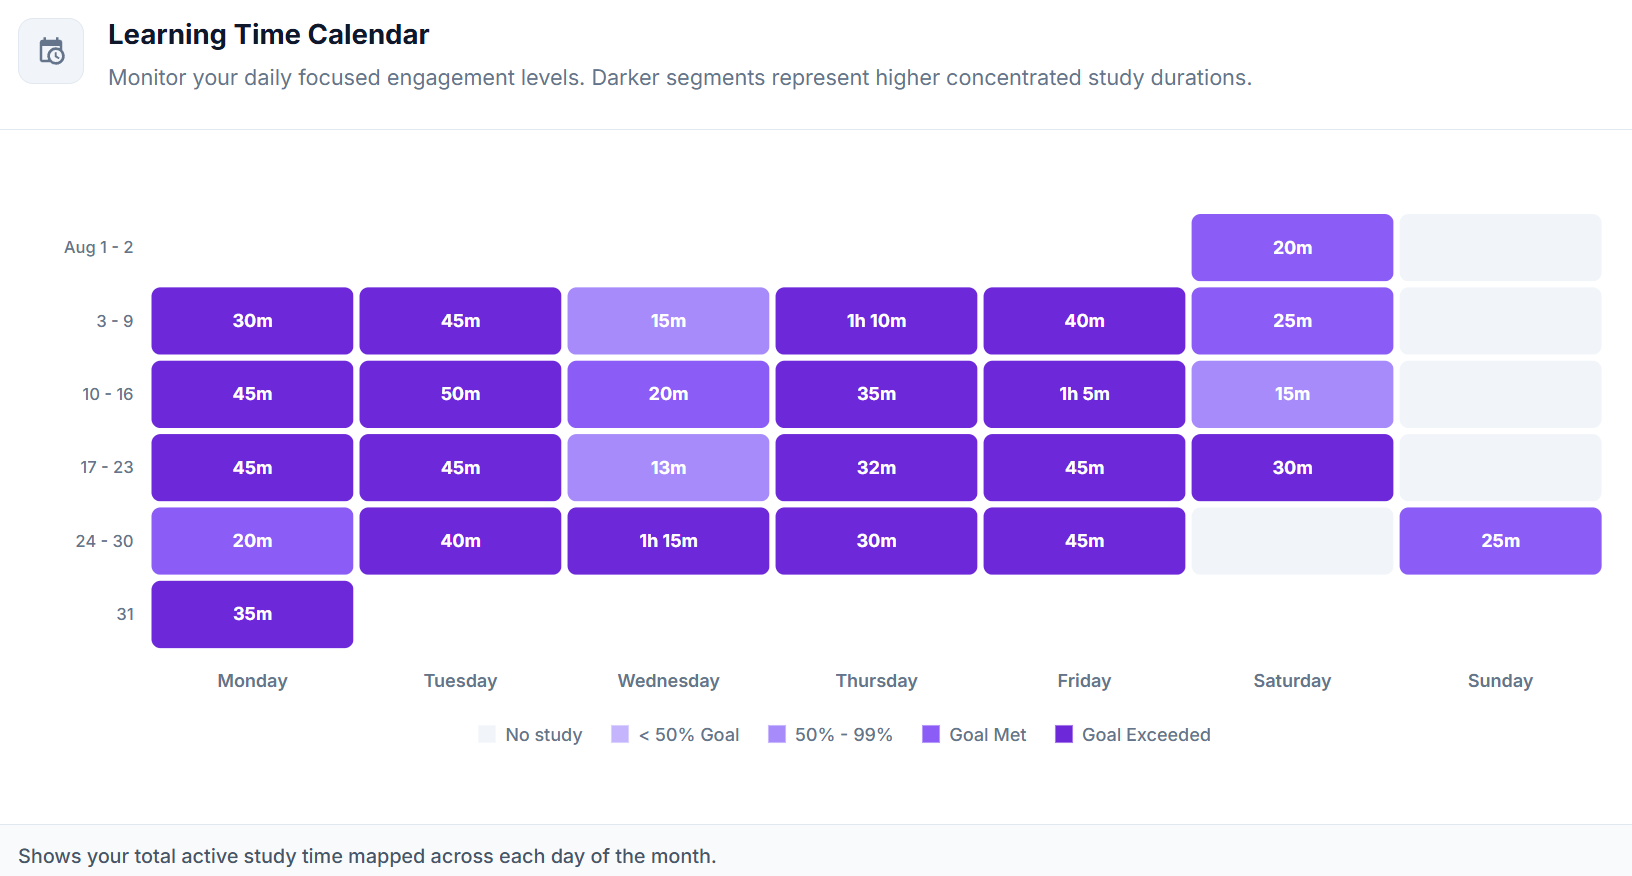
- Automatic Logging: Every time you track a study session using the Study Timer (
Begin) on an article, dialogue, word list, or lesson and click Finish, your active study duration is automatically logged to that day on the calendar. - Goal-Based Color Shading: Tile color density dynamically adapts relative to your daily target (calculated as
Weekly Goal ÷ 7 days):- No Study: Unshaded tile for rest days.
- < 50% Goal: Light lavender shading for quick catch-up sessions.
- 50% – 99% Goal: Medium purple shading for near-target study days.
- Goal Met & Exceeded: Deep, vibrant purple shading when you reach or surpass your daily benchmark.
- Interactive Goal Legend: Hover over any status label in the legend (
No study,< 50% Goal,50% - 99%,Goal Met,Goal Exceeded) at the bottom of the card to isolate and highlight all matching days across the calendar month. - Learn More: To see how study sessions are tracked and scored, check out our How to Track Study Sessions guide.